
SwingScan Pro: swing trading indicator for TradingView
Know where to buy and where to sell on any Indian or US stock
SwingScan Pro is a buy sell indicator for TradingView, built for swing trading. It marks buy and sell signals right on your chart: add to a stock at every Buy, then exit the whole position at the Sell. It works on every NSE, BSE, NYSE and NASDAQ stock available in TradingView.
WhatsApp is only for the price and access; we do not send signals or tips there. All buy and sell labels appear in your own TradingView chart. Educational tool, not investment advice. BCB Elevate is not SEBI-registered. Trading involves risk of loss. Read the disclaimer
- NSEIndia
- BSEIndia
- NYSEUnited States
- NASDAQUnited States
- 1DDaily timeframe
Buy and sell signals on a real chart: Federal Bank, NSE, daily
SwingScan Pro on the Federal Bank daily chart in TradingView, with the capital estimate and next exit points turned on. Each Buy shows the shares to buy, each Exit all shows how the cycle ended, and the orange labels show later exit points.
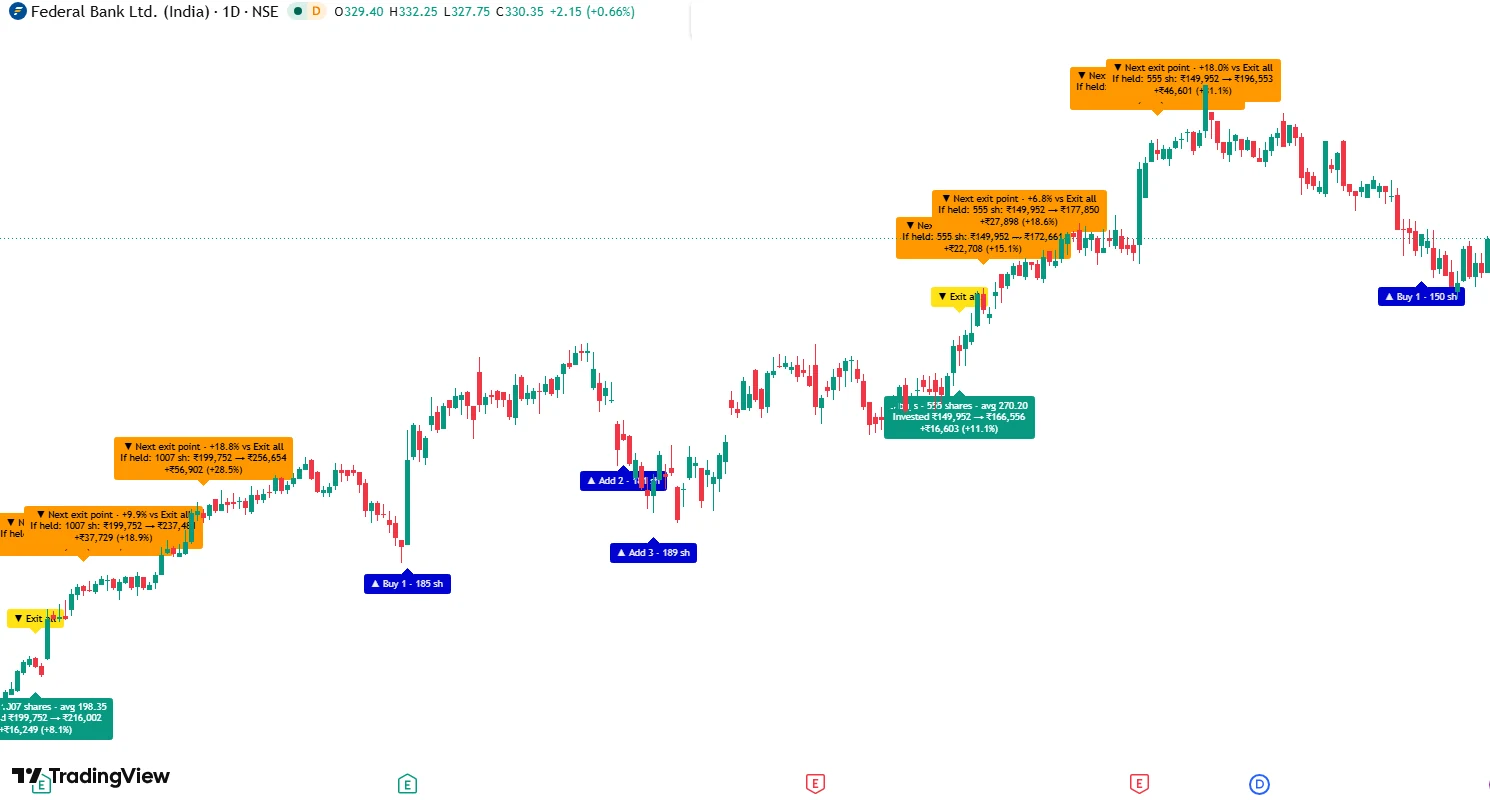
- Buy 1 starts a cycle
The first Buy of a cycle, with the shares your capital buys at that price.
- Add on the dips
Add 2 and Add 3 build the position in stages as the stock pulls back.
- Exit all
One Exit all label closes the whole position built from the earlier Buys.
- Cycle summary
Shares, average cost, money invested and returned, and the profit or loss for the cycle.
- Next exit point
Optional. A later sell signal after Exit all, with what the position would be worth if it was held until then.
What the buy sell indicator shows on your chart
Each cycle reads like a plan: Buy 1 starts a position, Add 2 and Add 3 build it on dips, and Exit all takes the whole position off.
- ▲ Buy 1Start a position
- The first blue label in a cycle appears when a pullback shows signs of turning back up.
- ▼ Exit allExit the whole position
- A yellow Exit all label appears when a rally shows signs of running out of steam.
- ▲ Add 2Add on every dip
- Each further dip before the exit is numbered Add 2, Add 3 and so on, so you build the position in stages instead of all at once.
- +%Cycle summary at every exit
- When Exit all appears, a tag shows how many buys you made, the shares and average cost, the money invested and returned, and the profit or loss.
- 47 shShares from your capital
- Type your capital in the settings: split it across a set number of buys, or use a fixed amount at every buy. Each Buy then shows how many shares to buy, and the summary shows the estimated profit or loss in money. Estimates exclude brokerage, taxes and slippage.
- Results panel
- A panel on the chart shows the open position, its value and unrealised profit or loss, and the results of past cycles on that stock. Switch it between full, compact and hidden, and move it to any corner.
- Alerts on your phone
- With a paid TradingView plan such as Premium, set an alert once and TradingView notifies you when a buy or sell signal fires.
- Any stock in TradingView
- Indian and US stocks, indices and ETFs, plus forex and crypto charts.
- Lifetime updates
- Every future improvement to SwingScan Pro is included at no extra cost.
Optional settings, off by default
- ▼ HoldExit only in profit
- If a sell signal comes while the position is in loss, the exit is skipped and a grey Hold label shows the loss. The position stays open until a later sell signal comes in profit. A stock that keeps falling can stay in loss for a long time.
- ▼ Next exitNext exit points
- Sell signals after an Exit all are shown in orange for anyone who did not sell at Exit all, with the change from the Exit all price and what the last position would be worth if sold there. A later exit can be lower as well as higher.
How to get SwingScan Pro
Message us on WhatsApp
Say hi on WhatsApp. We answer your questions and share the price. WhatsApp is only for access, not for signals.
Share your TradingView username
We add SwingScan Pro to your TradingView account as an invite-only indicator.
Add it to your chart
Open any stock, add SwingScan Pro from Indicators, then Invite-only scripts, and set your alerts.
Is this swing trading indicator right for you?
A good fit if you
- Swing trade Indian or US stocks and hold for days to weeks
- Want clear entry and exit ideas without watching charts all day
- Like to build a position in stages on dips and sell it in one go
- Already use TradingView, or are happy to start
Know the limits
- No indicator is right every time. A stock can keep falling after a Buy.
- Buying more on dips without a stop-loss can increase your losses. Set your own position size and limits.
- With Exit only in profit turned on, a losing position is held instead of sold and can stay in loss for a long time.
- It is tuned for daily charts, not for scalping or intraday trading.
- It marks signals on the chart you open; it does not pick stocks for you.
- It supports your analysis and risk management; it does not replace them.
Questions traders ask
Does SwingScan Pro work on Indian stocks?
Yes. It works on NSE and BSE stocks available in TradingView, and on Indian indices and ETFs.
Does it work on US stocks?
Yes. It works on NYSE and NASDAQ stocks, US indices and ETFs, and any other chart TradingView shows, including forex and crypto.
Which timeframe should I use?
SwingScan Pro is built for the daily chart, which suits swing trades that last from a few days to a few weeks. It runs on other timeframes, but the daily chart is where it is tuned.
Do I need a paid TradingView plan?
No. The indicator works on a free TradingView account. To get buy and sell alerts on your phone, you need a paid TradingView plan that supports indicator alerts, such as Premium.
How do investors use the Buy and Sell labels?
Buy 1 starts a position. Each further dip is labelled Add 2, Add 3 and so on, so you build the position in stages. Exit all marks where to sell the whole position, with a summary tag showing the buys, shares, average cost and the profit or loss for the cycle.
What does the Exit only in profit setting do?
It is off by default. When you turn it on and a sell signal comes while the position is in loss, SwingScan Pro skips the exit and shows a grey Hold label with the loss at that moment. The position stays open until a later sell signal comes while it is in profit. A stock that keeps falling can stay in loss for a long time, so use it only with money you can leave invested.
What are next exit points?
An optional setting, off by default. Sell signals that come after an Exit all are shown as orange Next exit point labels for anyone who did not sell at Exit all. Each one shows the change from the Exit all price and what the last position would be worth if it was sold there instead. These figures are worked out from past prices after the fact; a later exit point can be lower than Exit all as well as higher.
What is the best TradingView indicator for swing trading?
There is no single best indicator for everyone. A good swing trading indicator should give clear buy and sell signals on the daily chart, confirm them when the candle closes and fit how you manage risk. SwingScan Pro is built for one approach: buying a stock in stages on dips and selling the whole position at one exit.
Is there a 100% accurate buy sell indicator?
No. Any indicator that claims to be 100% accurate is misleading you. Buy and sell signals are based on past prices and some will be wrong. SwingScan Pro shows the result of every past cycle on the chart, including the losing ones, so you can judge it yourself.
Can I use it for options or intraday trading?
SwingScan Pro is tuned for swing trading stocks on the daily chart, holding for days to weeks. It is not designed for options, scalping or intraday trading.
Is SwingScan Pro free?
No. SwingScan Pro is a paid indicator; message us on WhatsApp for the price. It works on a free TradingView account, and alerts need a paid TradingView plan.
Does SwingScan Pro give a stop-loss?
No. It is built for accumulating on dips and selling the whole position at the Sell, so it does not mark a stop-loss. Decide your own position size and the most you are willing to lose on each stock before you start.
Does it repaint?
Signals are confirmed when the daily candle closes. While today's candle is still forming, a label can appear and disappear as price moves. Once the candle closes, the label stays on the chart.
Can it scan many stocks at once?
On its own, SwingScan Pro marks signals on the chart you open. Some paid TradingView plans include the Pine Screener, which can run indicators across a watchlist; check TradingView's plan details.
How do I get SwingScan Pro and what does it cost?
Message us on WhatsApp at +91 88480 63402. We answer your questions, share the price and then add the indicator to your TradingView account. WhatsApp is only for access and support; we do not send signals, tips or calls there. The buy and sell labels and alerts come only from the indicator in your TradingView.
Is this investment advice?
No. SwingScan Pro is an educational technical analysis tool. Its labels are not recommendations to buy or sell any security, and you remain responsible for your own trading decisions.
See SwingScan Pro on your own stocks
Message us on WhatsApp for the price and access to the indicator. Once it is on your TradingView account, every signal appears on your own chart.
Disclaimer
SwingScan Pro is a technical analysis indicator provided for educational purposes only. BCB Elevate Trading is not registered with SEBI or any other regulator as an investment adviser or research analyst, and nothing on this page or in the indicator is investment advice or a recommendation to buy, sell or hold any security.
Buy and sell labels and cycle summaries are generated automatically from price data and can be wrong. Adding to a position at every Buy without a stop-loss can increase losses if a stock keeps falling. Holding through a loss with Exit only in profit can keep capital tied up in a falling stock. Results shown in the panel and on next exit point labels are calculated from past prices after the fact and exclude brokerage, taxes and slippage. Past signals do not guarantee future results. Trading stocks involves risk, including the loss of your capital. Make your own decisions, trade only with money you can afford to lose, and consult a SEBI-registered investment adviser before investing. Read our full risk disclosure.
TradingView is a trademark of TradingView, Inc. SwingScan Pro is an independent product and is not affiliated with TradingView, NSE, BSE, NYSE or NASDAQ.